Click-to-Capture Daisen Traces in AkitaRTM

Detailed visualization traces are invaluable for debugging and performance analysis—but tracing an entire simulation is expensive and produces enormous output files. In practice, most users only need a short window of execution to inspect later in Daisen.
Starting in Akita v4.9.0 (and MGPUSim v4.1.5), trace capture is now interactive. You can start and stop Daisen trace collection directly from AkitaRTM while the simulation is running.
This change also removes the old --trace-start-time and --trace-end-time arguments. Those options only worked if you already knew the exact cycle range ahead of time—which is rarely the case.
The New Workflow
Typically, the goal is to record a short period of stable execution, not the entire run. You can now do that with a simple record-button flow:
- Launch the simulation and open AkitaRTM.
- Wait for warm-up to finish until the metrics stabilize.
- Click Start Tracing in AkitaRTM when you're ready to record.
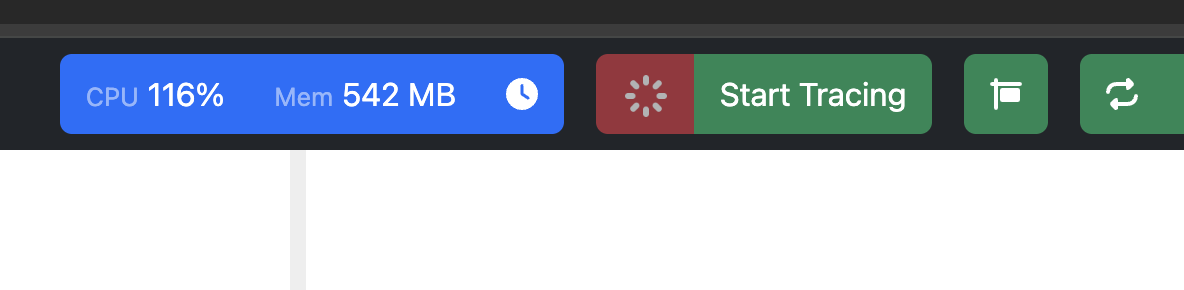
- AkitaRTM displays a recording indicator so you can confirm collection is active.
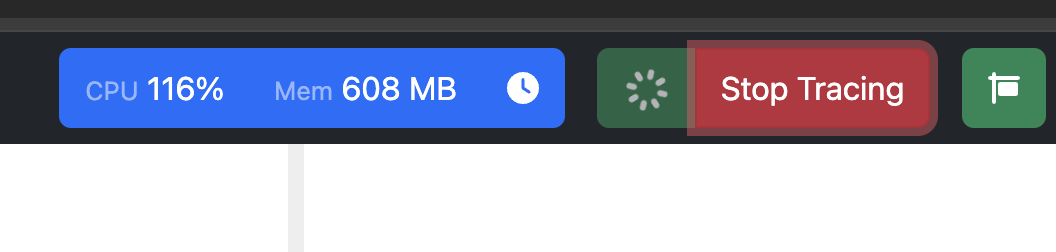
- Click Stop Tracing once you've captured enough cycles.
- Open Daisen and analyze the collected window.
The same workflow applies when you want to capture a specific event mid-run—say, a sudden performance drop. Just start tracing near the moment you care about and stop after you have enough data.
Simpler Setup
You no longer need to manually attach visualization tracers in your configuration code.
As long as your components are registered with the simulation (the standard pattern), the framework automatically wires up AkitaRTM and the Daisen trace collector. The tracing button just works.
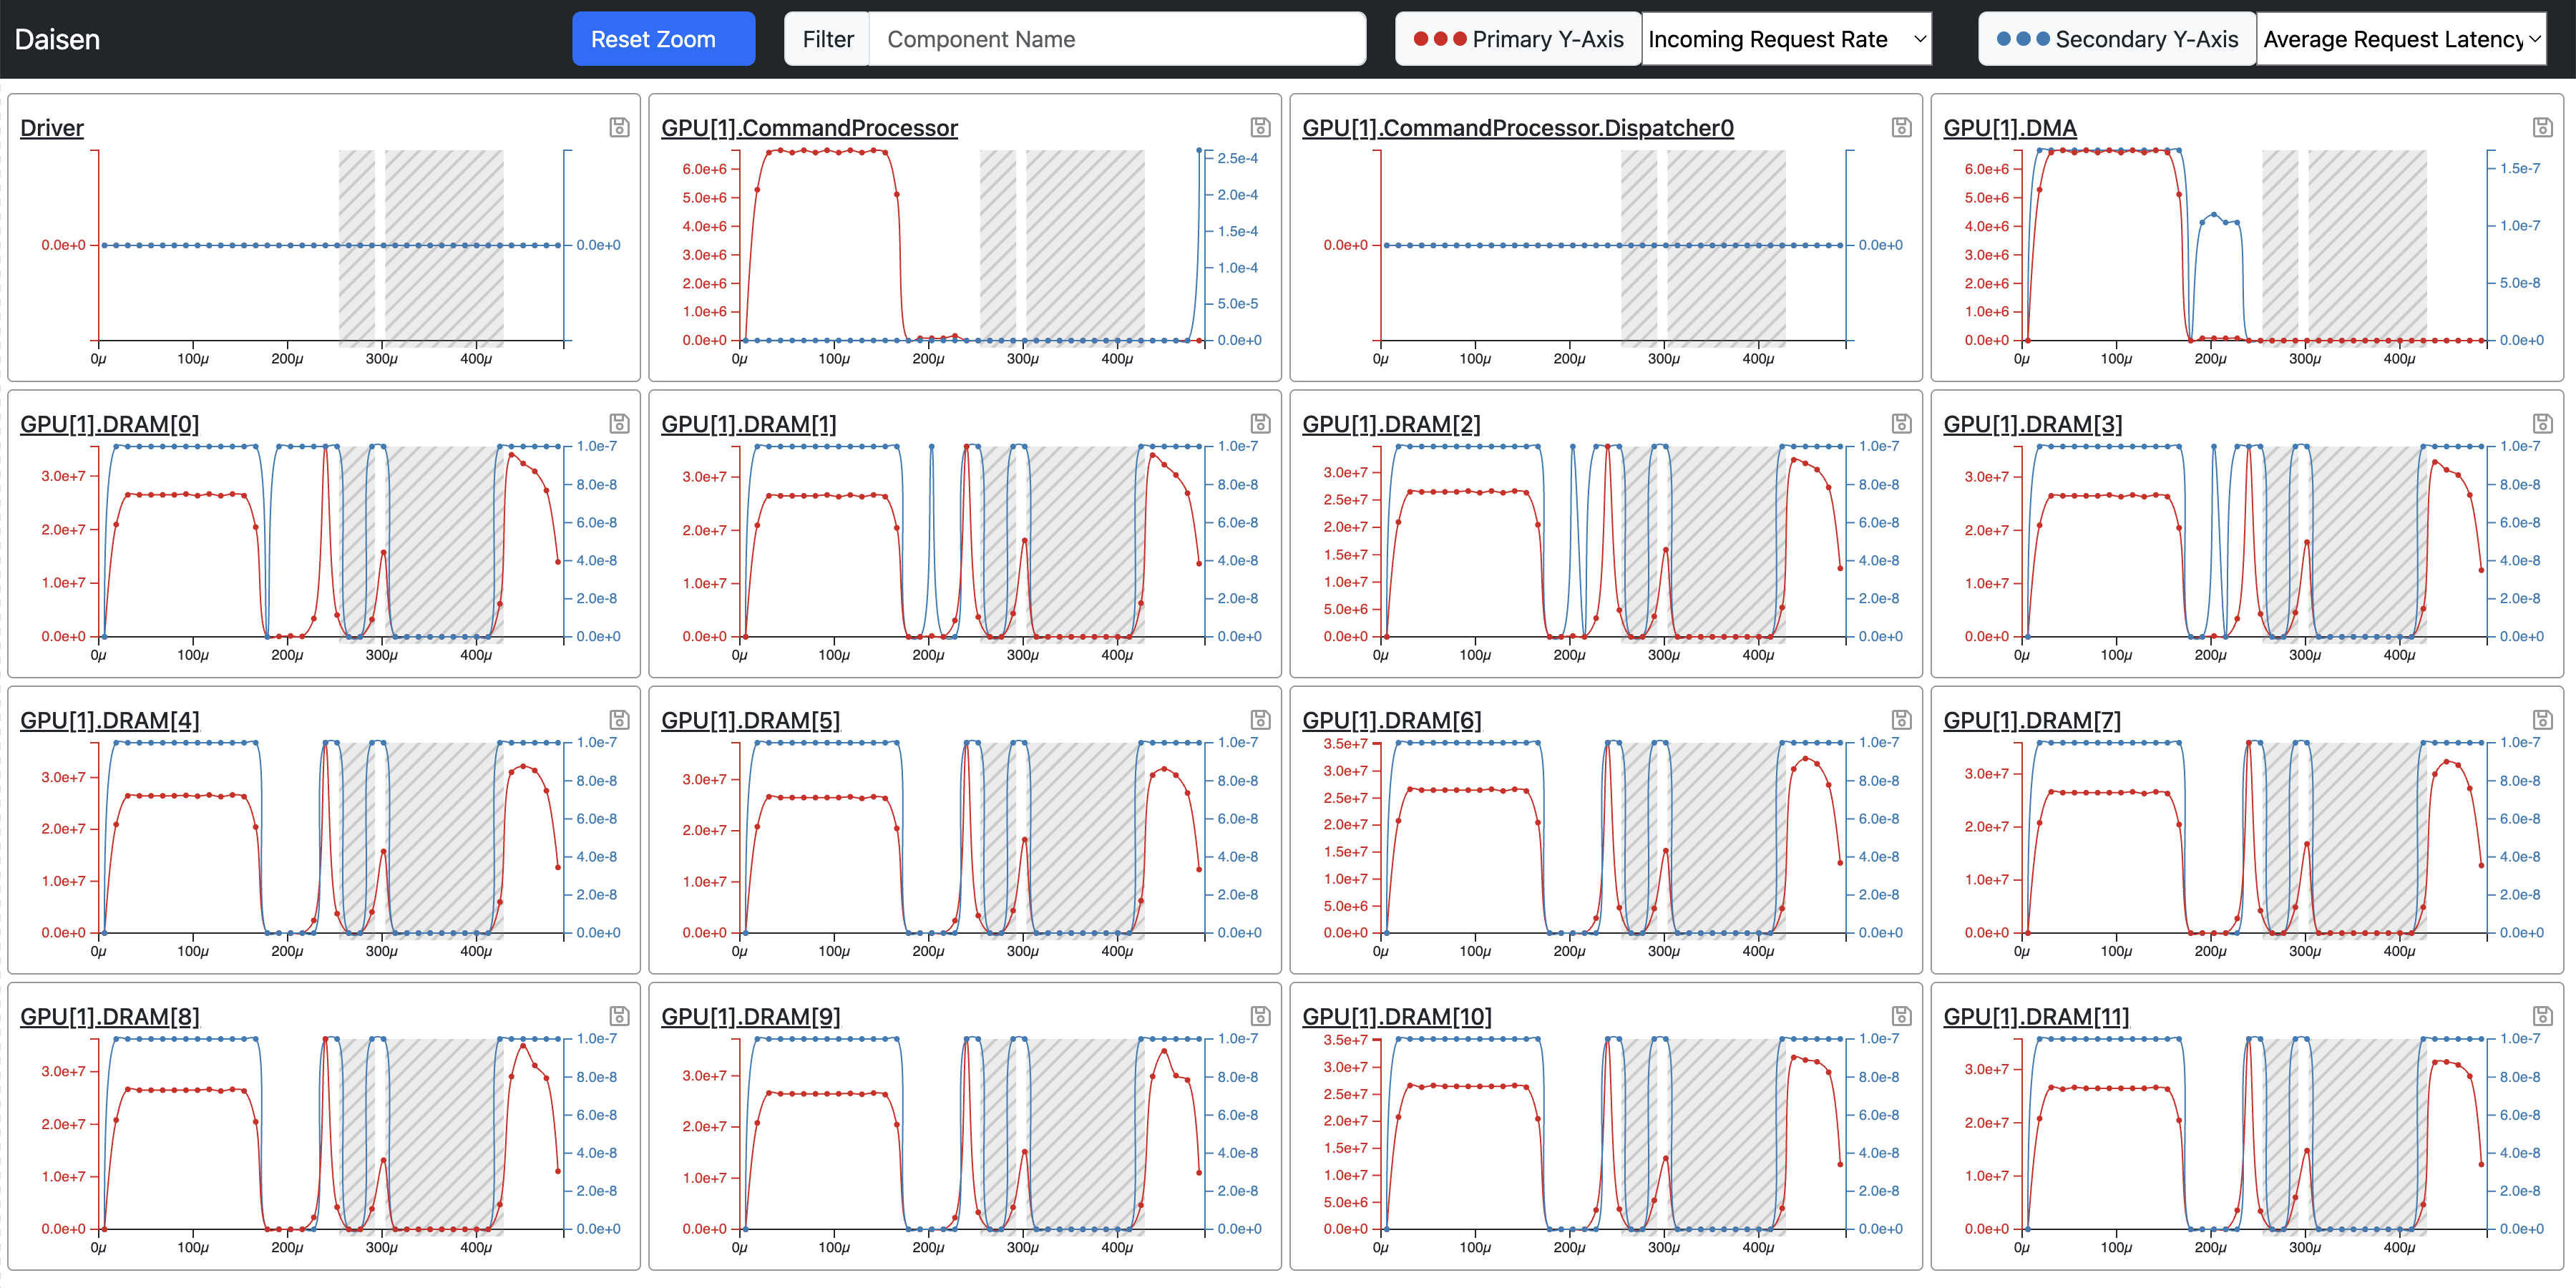
What You'll See in Daisen
Daisen clearly distinguishes recorded regions from unrecorded ones. Shaded areas mark the time ranges where traces were not collected.
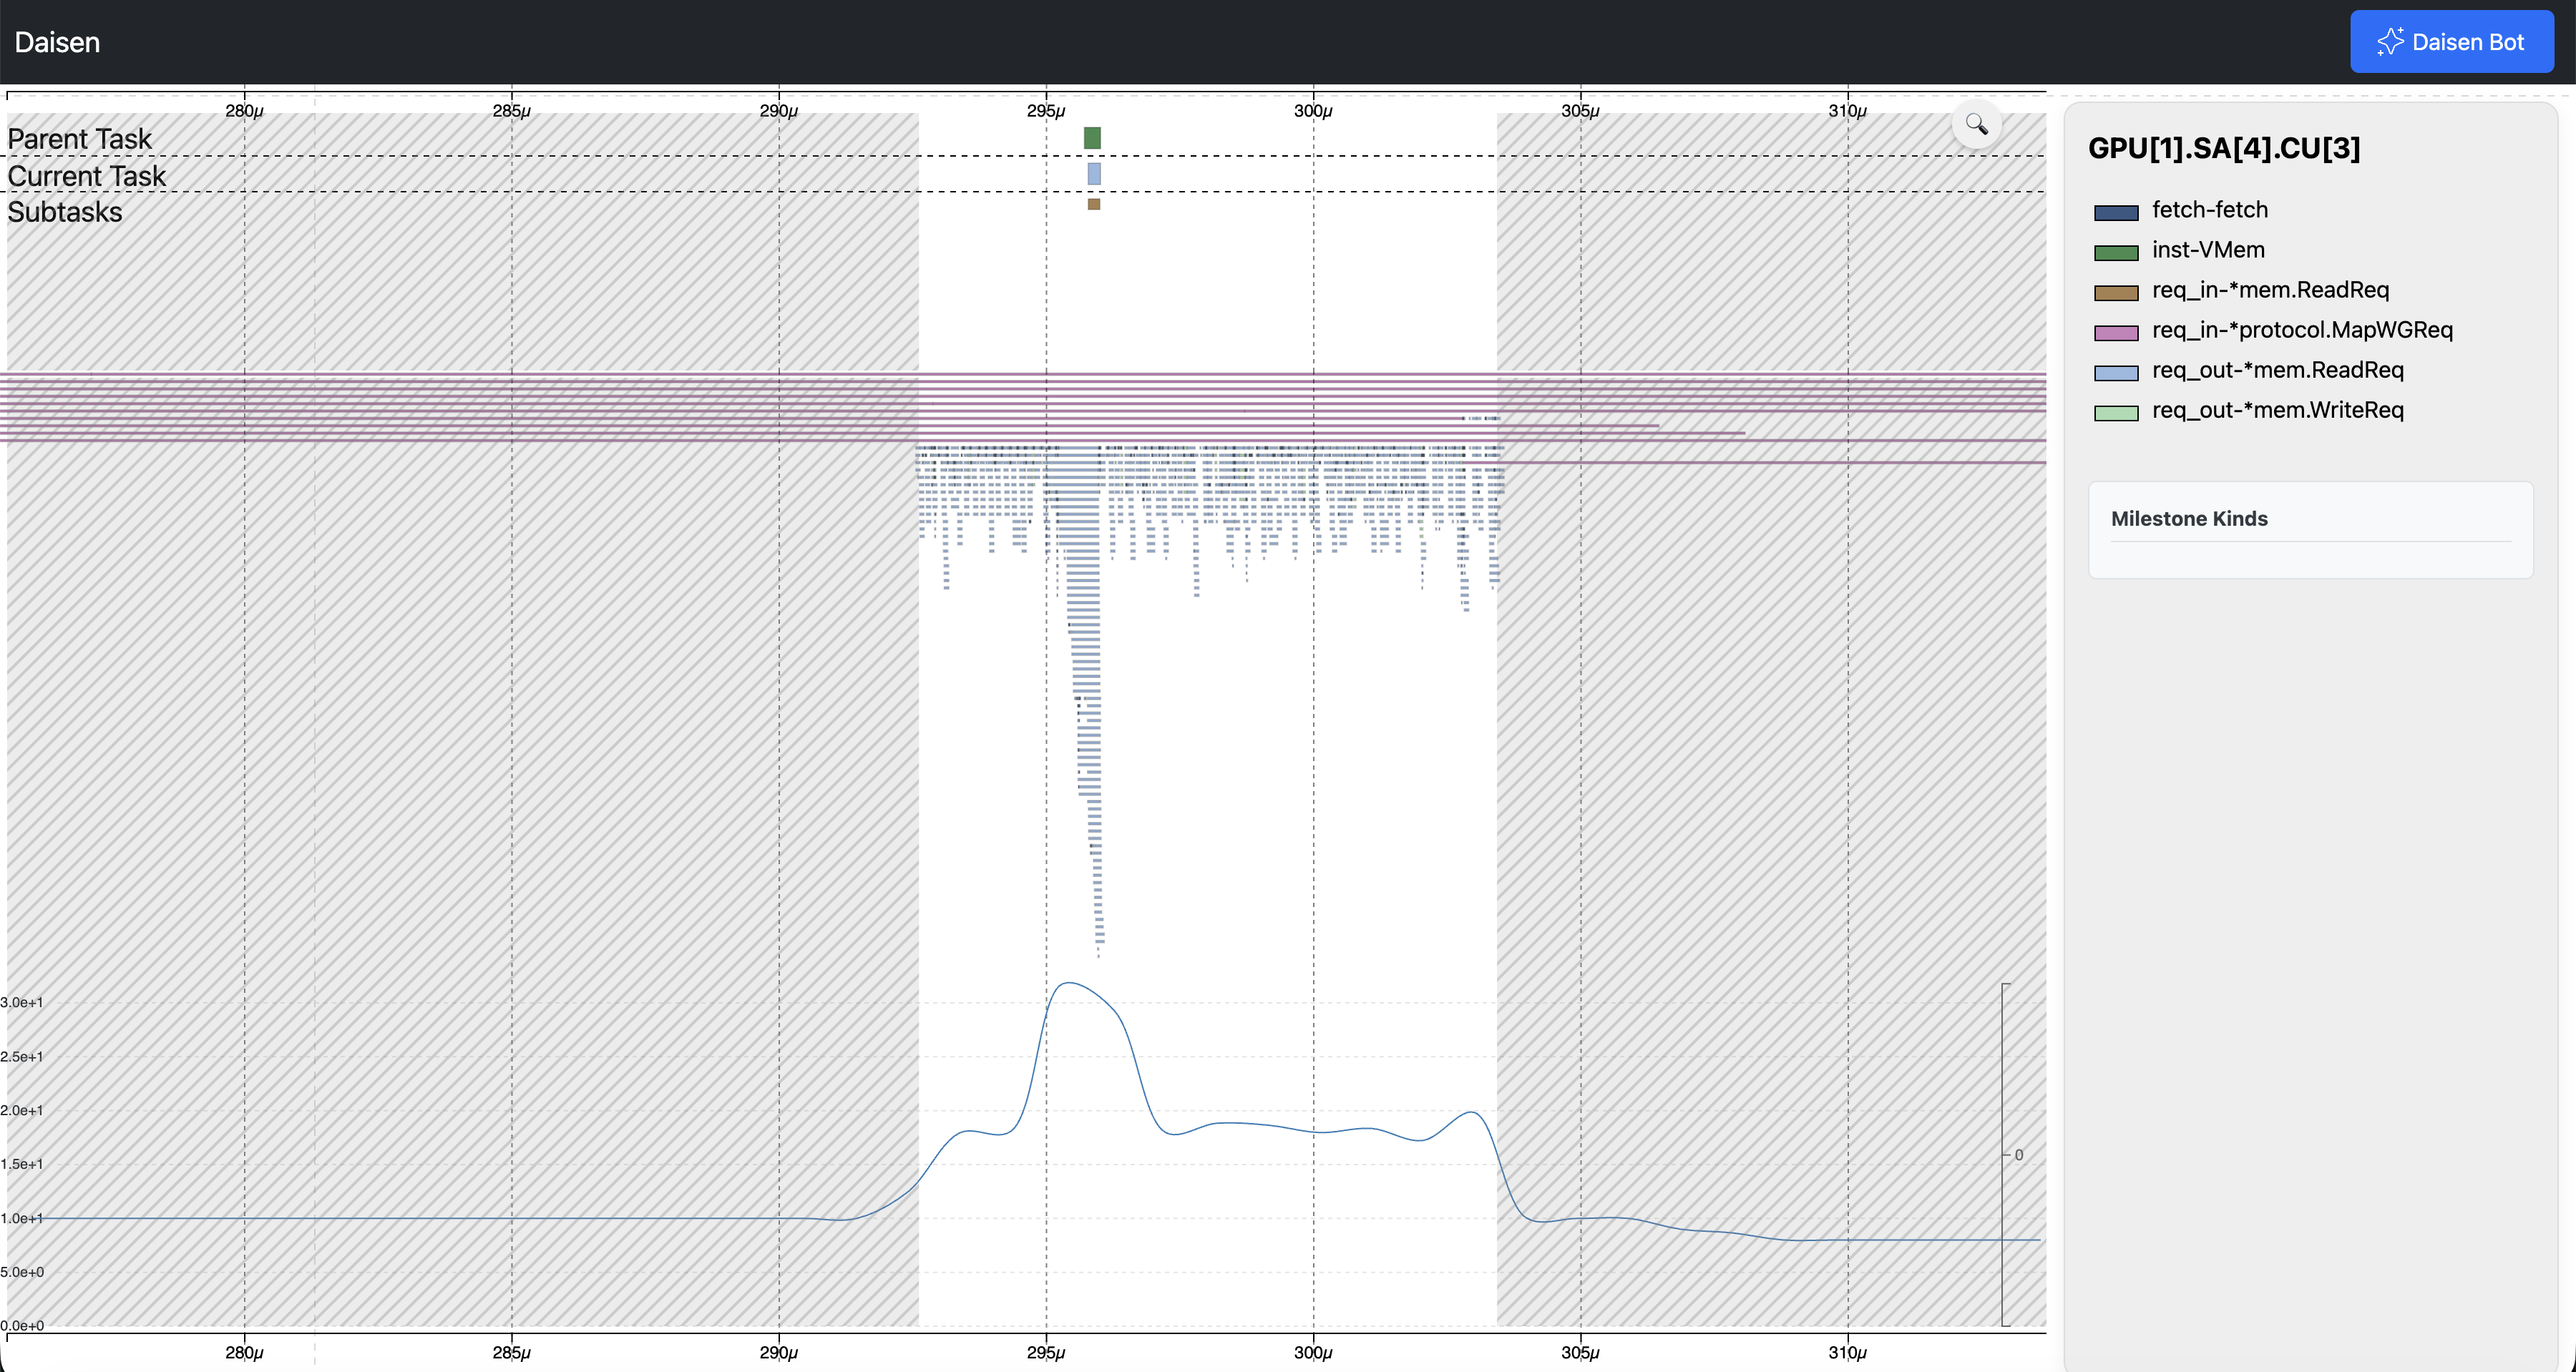
A task appears in the trace if it overlaps the collection window by at least one cycle. This inclusive boundary makes the data easy to work with—tasks that barely cross the start or stop point still show up.
Tracing from Cycle 0
If you know upfront that you want traces from the very beginning, --trace-vis still does exactly that: it starts collection immediately when the simulation launches.
Without --trace-vis, you can still collect traces later. The Start Tracing button in AkitaRTM works at any point during execution, even if the simulation started with tracing disabled.
Why This Matters
This feature aligns with how tracing is actually used in practice:
- Run first, then record—capture a short, stable window (or any window you care about).
- No guesswork—stop estimating cycle ranges ahead of time.
- Smaller, focused traces—keep output files manageable.
- Seamless handoff—go directly from "I see it in AkitaRTM" to "I can analyze it in Daisen."
At its core, this change reflects a broader design philosophy: simulation tools should adapt to how researchers actually work, not the other way around. The old approach—predicting cycle ranges before running—forced users into a tedious guess-and-rerun loop. Interactive tracing eliminates that friction, making detailed performance analysis accessible without requiring clairvoyance or patience for multi-hour trace dumps.